Reports are available for Admins, Authors, and Reporters.
The Reports section shows you statistics on your organization's forms. There are five reports available:
For each report, you can also use the search bar to Search forms and workspaces, use the Date range drop-down menu to see data from a specific period, and Export the report to Microsoft Excel or CSV. By default, the date range is set to the Last 7 days but you can choose any given or Custom period. Each report is also paginated and you can use the Items per page drop-down menu to show more forms per page.
The Reports page is designed to show you an overview of form statistics. Exported files will show you a more detailed version of your reports, particularly regarding your Payments received, which shows a breakdown of cost details.
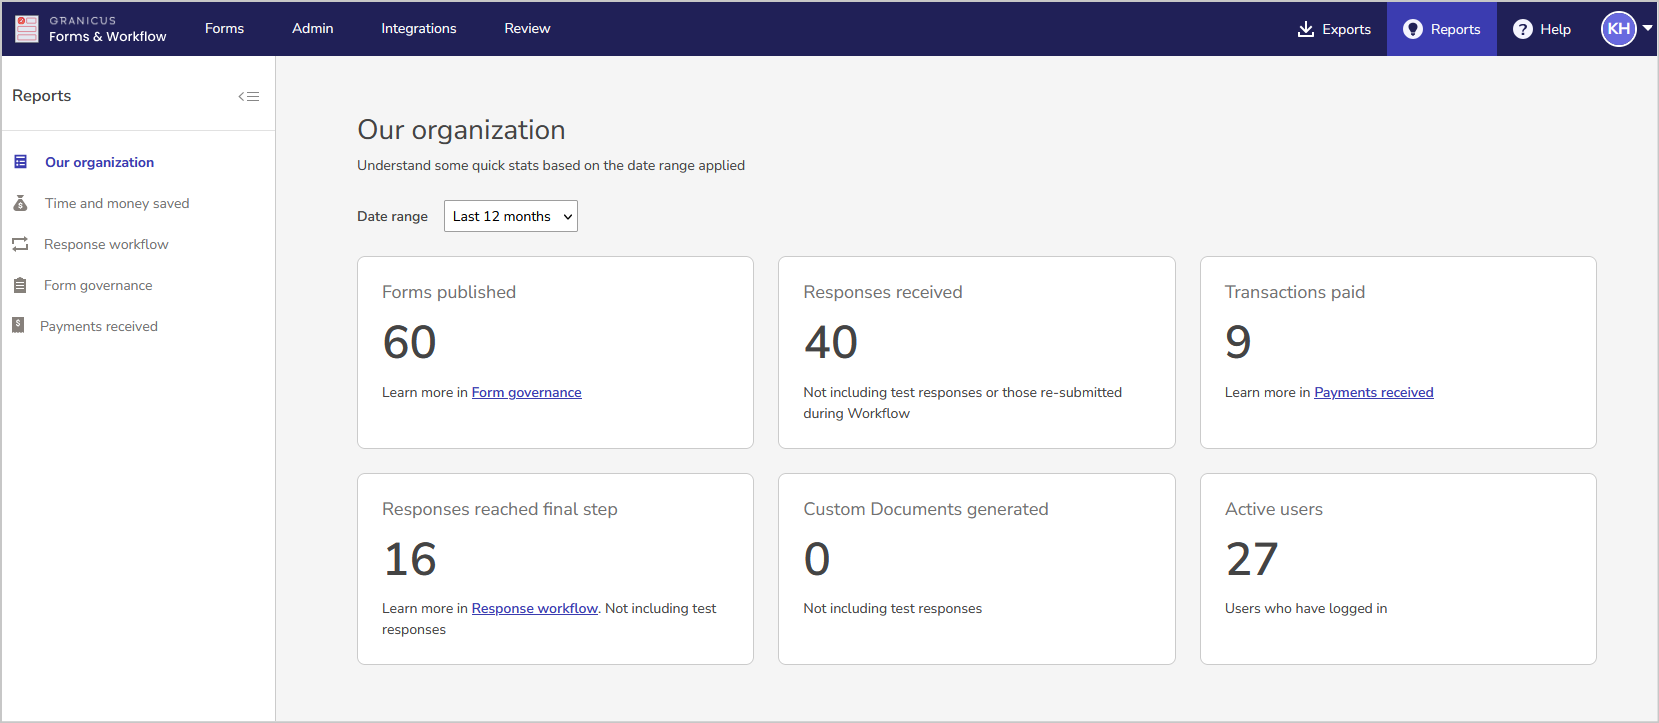
Our Organization
This report shows some quick statistics about your forms account and can help provide an overview of your organization's activities. The report provides the numbers for:
- Forms published: The number of forms published within the Date range. Select Form governance to learn more form editing and publishing statistics.
- Responses received: The responses received on all forms within the Date range, but not including test responses or responses resubmitted during a workflow.
- Transactions paid: The number of paid transactions in responses submitted within your Date range; select Payments received for more details about transactions generated by your forms.
- Responses reached final step: The number of responses that have reached the final step in a form workflow within the Date range, but not including test responses. Select Response workflow for more statistics about workflows and your reviewing processes.
- Custom Documents generated: The amount of custom documents that have been generated for responses submitted within the Date range, but not including test responses.
- Active users: The number of users who have logged in to your account during the provided Date range.
Time and Money Saved
This report shows you how much time and money your forms are saving your organization once you have set each form's savings. The report will remain accurate even after deleting old form responses, as long as the form itself has not been deleted.
At the top of this screen are total figures for Respondent time saved, Organization time saved, and the total amount of Organization money saved based on the date range you chose.
Below the overall organization figures is a list of all your organization’s forms, listed with the:
-
Form / workspace: The form's name and workspace.
-
Responses: The number of responses to this form.
-
Resp. time saved: The average response time saved per form.
-
Org time saved: The average organization time saved per form.
-
Org money saved: The money each form has saved your organization.
Select any of these headings to reorder your forms by these criteria and select any form name to open it. You can only view or edit a form if you have permission to open it.
To see the data for the time and money saved, you must first set up each form's savings.
Set Up Form Savings
Time and money savings are based on your inputs in each form’s ... menu.
Select this and choose Edit savings to add:
-
The Minutes saved by respondent, compared to offline interactions
-
The Minutes saved by staff, compared to serving offline interactions
-
The Dollars saved by organization, based on staff time saved
Edit these figures based on your offline interaction costs to get an estimate of the time and money you’ve saved across your chosen date range. If you make major changes to a form, consider updating savings figures when it goes online. Use the Edit next form's savings checkbox to start using your new figures the next time your form gets a response.
Response Workflow
This report shows you a snapshot of your review activity, if you're using response workflows to process submitted forms.
At the top there is overall data about the number of New submitted requests, Pending requests, and Finalized requests in your specified date range, as well as the Avg time to resolution, from submission to review completion.
Below these overall stats, you'll find the details of every published form with a response workflow, which you can sort by the following criteria:
- Form / workspace: The form name and workspace.
- Previously remaining: The number of outstanding responses (submissions yet to be finalized) in your review center at the beginning of your specified date range.
- Submitted: The number of new submissions in your specified date range.
- Finalized: The number of responses that have progressed to a final step and been finalized in your specified date range. These can be more than the number of submissions if you had outstanding responses awaiting review at the beginning of the date range.
- Avg time to resolution: The average time to resolution of a response, from submission to finalization.
- Remaining: The number of responses that are yet to be finalized at the end of your specified date range.
Use this information to see how well your reviewers are clearing submissions as they enter the review center.
If you notice that a particular form has many more submissions than it does finalized reviews, there may be a bottleneck in a particular step of that review process.
Select the form name to go to the Analytics tab for that form, where you can view a more detailed breakdown of the review information, including which review steps are taking the longest to complete, or falling behind the number of submissions coming through.
This report is only available for certain subscriptions; please contact us to discuss the features of your subscription.
The Form governance report provides an overview of editing, publishing, and response statistics for your forms. Use the Last edited date drop-down menu to display forms in the desired period and select All time to see all forms. You can sort the list by column by selecting the column headers to reorder the list based on those variable. Not all columns can be sorted; for example, to sort by storage you must export to excel and sort from there.
This report will help you when trying to do a clean-up of old forms. The Last published, Latest response, and Responses count will help show you which forms you can archive and which you need to keep. If an old form has no recent responses, or a low response count, you can probably archive it or it's time to edit and share it again.
The forms list will show:
- Form / workspace: The name of the form and workspace. Select this to go to the form.
- Last published: The time and date the form was last published, and the user who published it.
- Last edited: The time and date the form was last edited, and the user who edited it.
- Latest response: The time and date of the most recent response to the form.
- Responses: The number of responses the form has received.
- Version: The version and status of the form.
- Storage: The amount of storage this form is using.
Payments Received
This report is only available on certain subscriptions and only Admin users can access transaction data. Please contact us to discuss your subscription features.
This report shows all financial transactions generated through your forms. At the top of the report, you will see the number of Transactions and the Total amount transacted in the chosen period. The list of forms will show the:
- Date received
- Transaction ID
- Amount
- Form / workspace
- Form receipt number
Exporting this report will provide additional transaction details, including a breakdown of the total cost and any attached fees for the transaction.