As people use your forms, we tally the total number of responses for each form or form version.
You might notice that the total number of responses you see can vary between the Analytics, Reports, and form responses screens, as well as emailed response snapshots. For example:
- The Forms dashboard shows the current response count for each form, excluding deleted responses, when Show full details is enabled.
- A form's Responses tab shows the current response count for that form, excluding deleted responses.
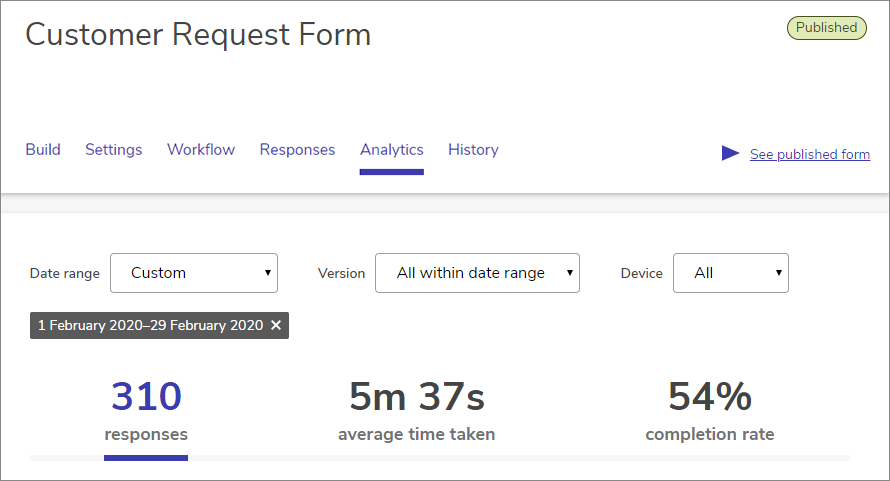
- A form's Analytics tab tracks the form's responses over time and is based on data that we collect. Because of this, you may see some variance in the response count based on the date range chosen, your plan, and if the user has any browser software that prevents data collection.
- The Time & Money Saved chart in Reports shows the total response count for forms including deleted responses. This chart shows historical data and is based on the date range you choose.
Here’s how we tally form responses across the platform:
|
Analytics |
Reports |
Responses |
Snapshot emails |
| Completed responses |
Yes |
Yes |
Yes |
Yes |
| Abandoned responses |
- |
- |
- |
- |
| Deleted responses |
Yes |
Yes |
- |
Yes |
| Test responses |
- |
- |
Yes |
- |
| Responses prevented by stop logic |
Yes |
- |
- |
Yes |
For a deeper understanding of each of the response tallies available, see: